
2022 started off with an extremely strong market as the intense demand from Q4 2021 spilled into the new year but things seemed to have shifted a bit at the end of February when the war in Ukraine began & COVID case numbers started rising again.
Despite this, it was still the 2nd best Q1 on record.
Overall the market seems to be entering a more "balanced" phase as of mid-to-late March with the hyper-competition between buyers that was commonplace to see in January now becoming more rare.
Price appreciation isn't necessarily slowing down (actually quite the opposite as seen in the stats below), it's just that buyers now have more inventory to choose from so the properties with not so great layouts/views/finishings/etc. are the ones experiencing a bit of a "slowdown" in interest.
This is more akin to the marketplace that we had in 2019 prior to the start of the COVID pandemic and conditions are likely to remain this way as we progress through the year and see many of the new development projects currently underway finish construction and begin occupancy.
The big question that comes to mind is why has this shift in the market occurred?
It comes down to 3 primary factors that have affected home buyers interest level for purchasing at this time.
1.) There was a super competitive winter market which exhausted many buyers as inventory was very low but demand remained exceptionally high.
Normally buyers use these winter months to recuperate before the spring market begins (when inventory levels normally pick back up) but that didn't seem to be the case this year.
2.) Rising interest rates are shrinking the buying power of many potential homeowner's.
3.) Uncertainty in the global economy as we deal with the war in Ukraine along with supply/transportation issues that many industries are currently experiencing.
For many buyers, this combination of factors has made them reassess the situation & some have decided to shelf their home search for now.
Here's a snapshot of what happened in Q1 2022
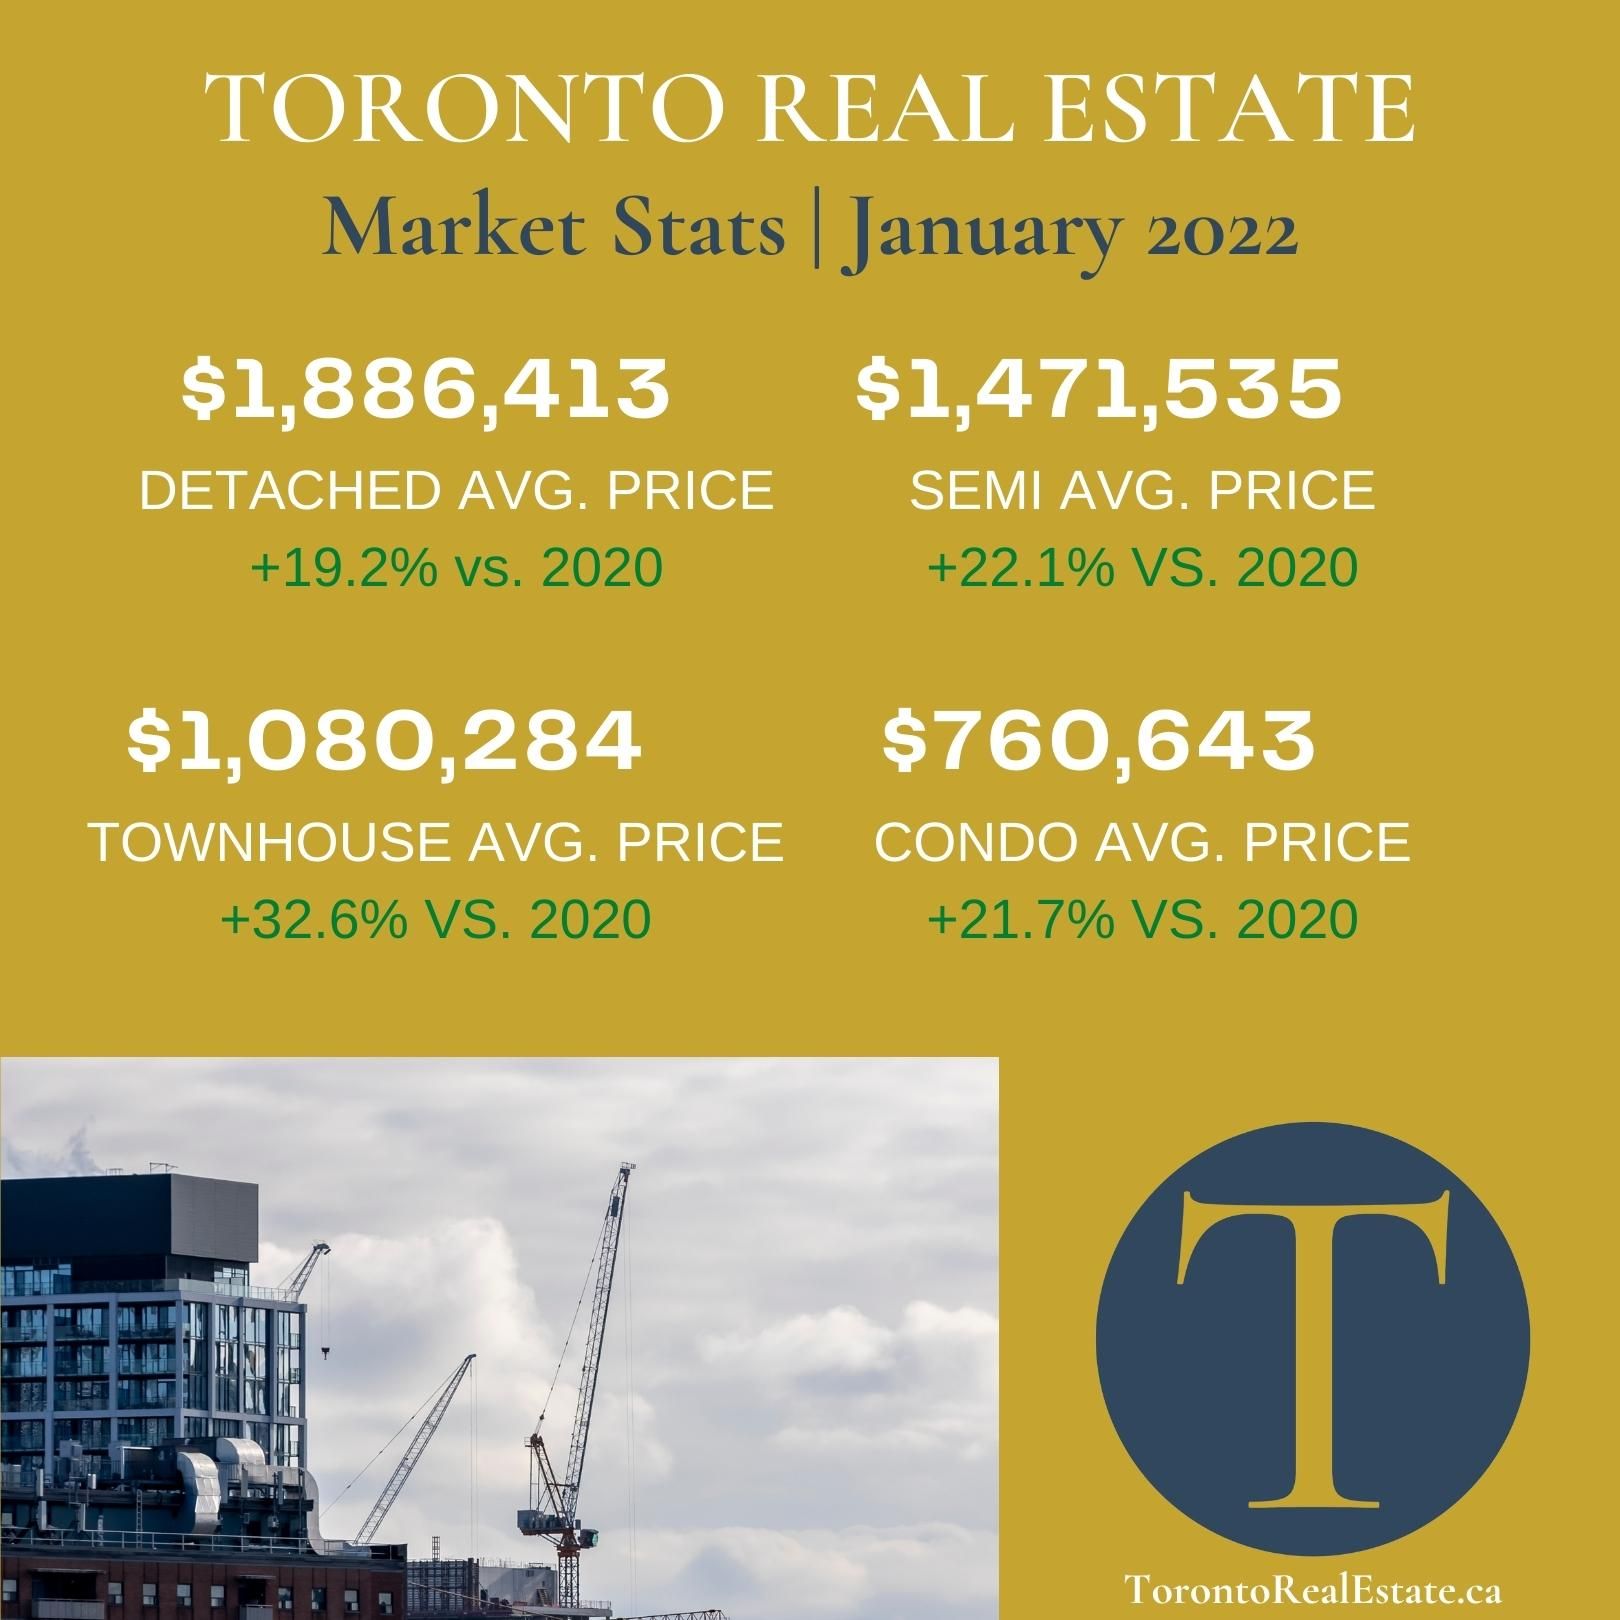
January
- Demand remained very strong
- Listings remained in short supply
- Tight market conditions
- Strong year-over-year price growth
- 2nd best January in history
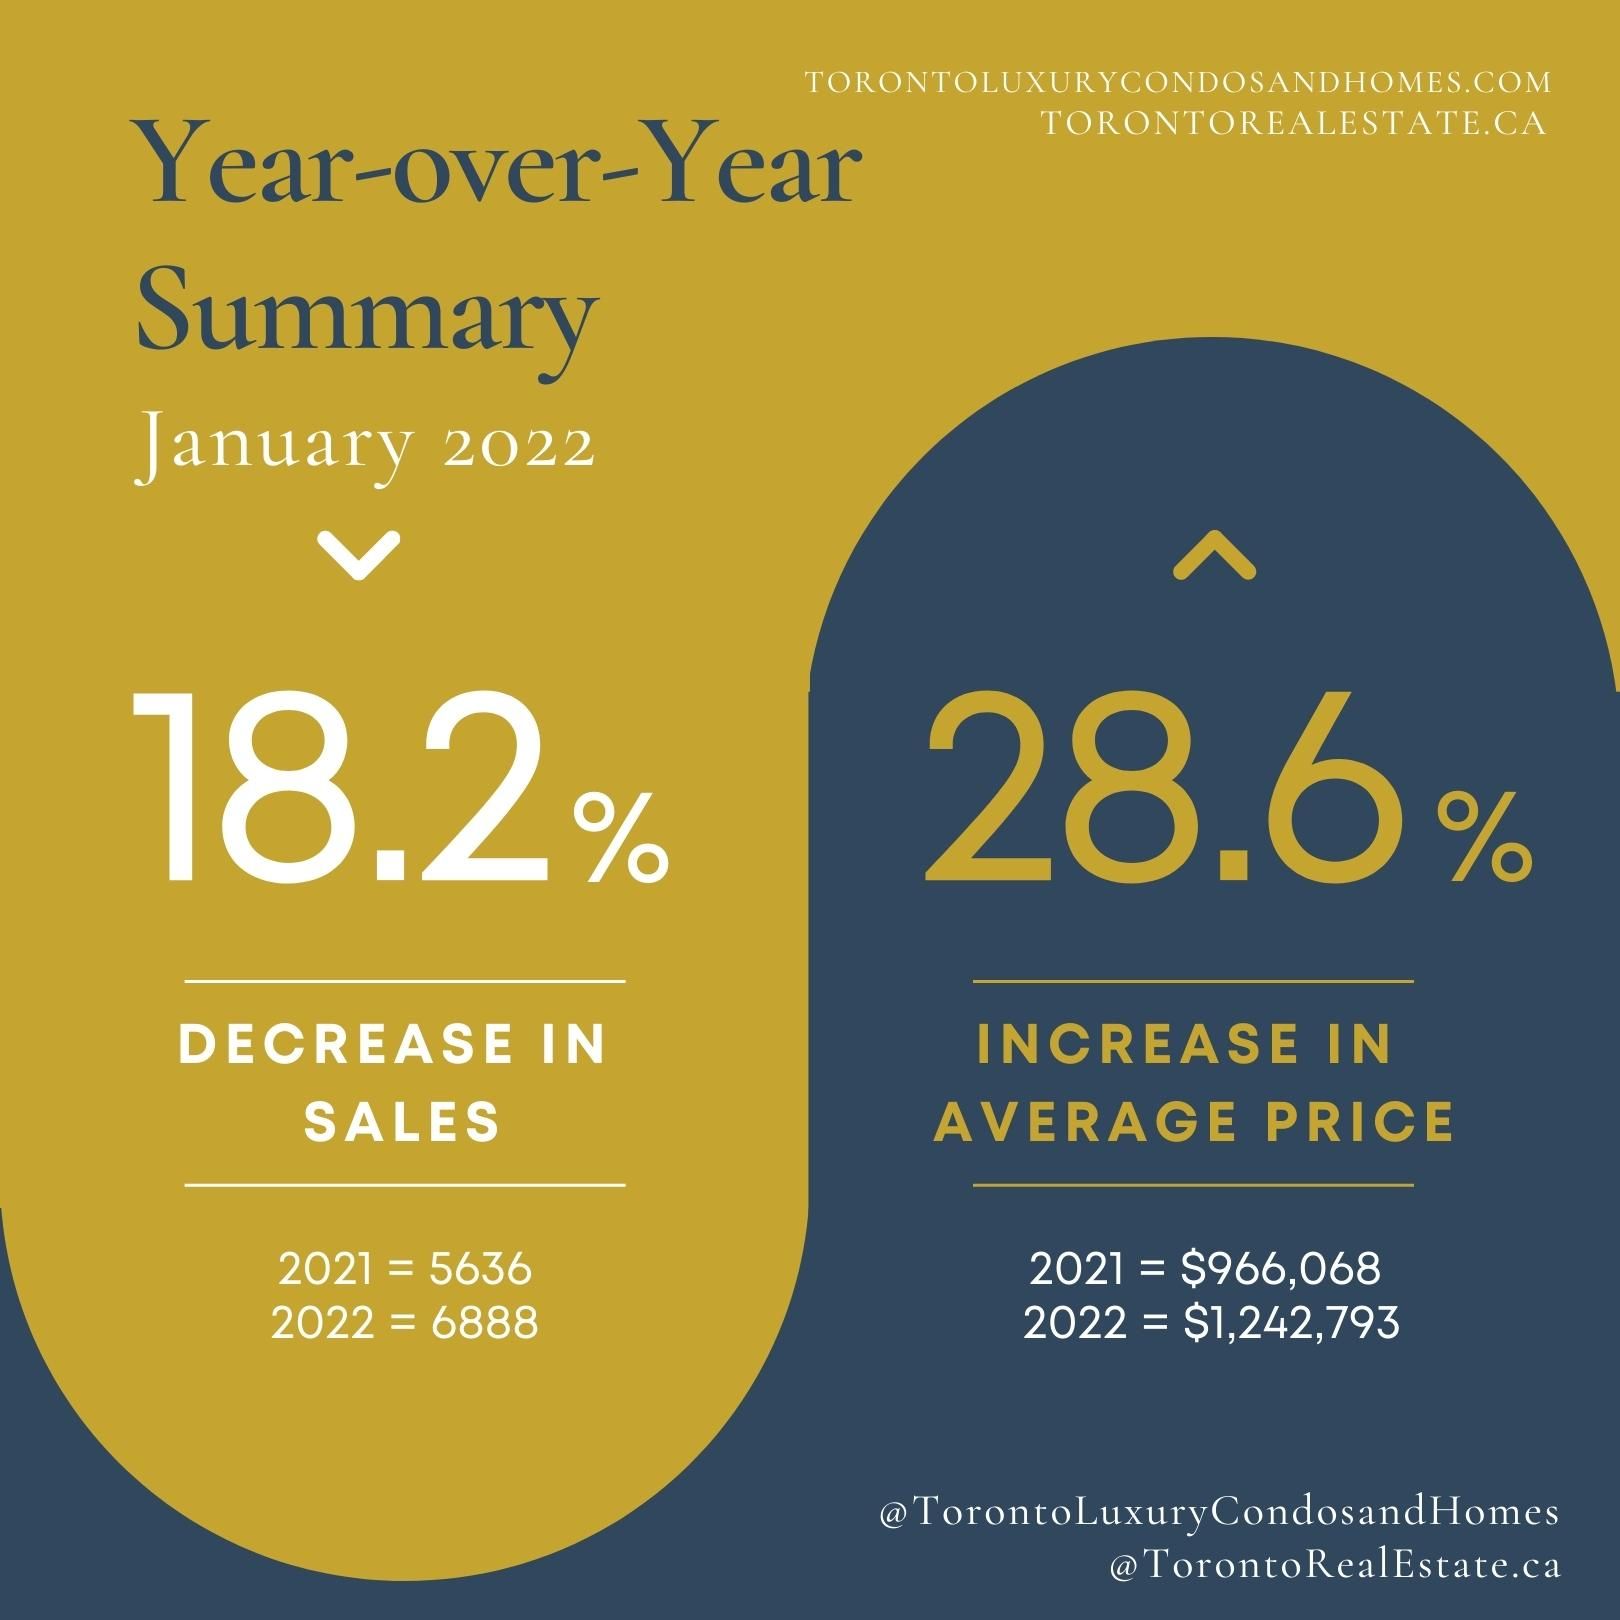
- Sales | 5,636 (-18.2% vs. 2021)
- New Listings | 7,979 (-15.5% vs. 2021)
- Active Listings | 4,140 (-44% vs. 2021)
- Average price | $1,242,793 (+28.6% vs. 2021)
- Detached | Average price = $1,886,413 (+19.2%) | Sales = 476 (-7.6%)
- Semi-Detached | Average price = $1,471,535 (+22.1%) | Sales = 144 (-11.1%)
- Townhouse | Average price = $1,080,284 (+32.6%) | Sales = 203 (-21.6%)
- Condo | Average price = $760,643 (+21.7%) | Sales = 1409 (-17%)
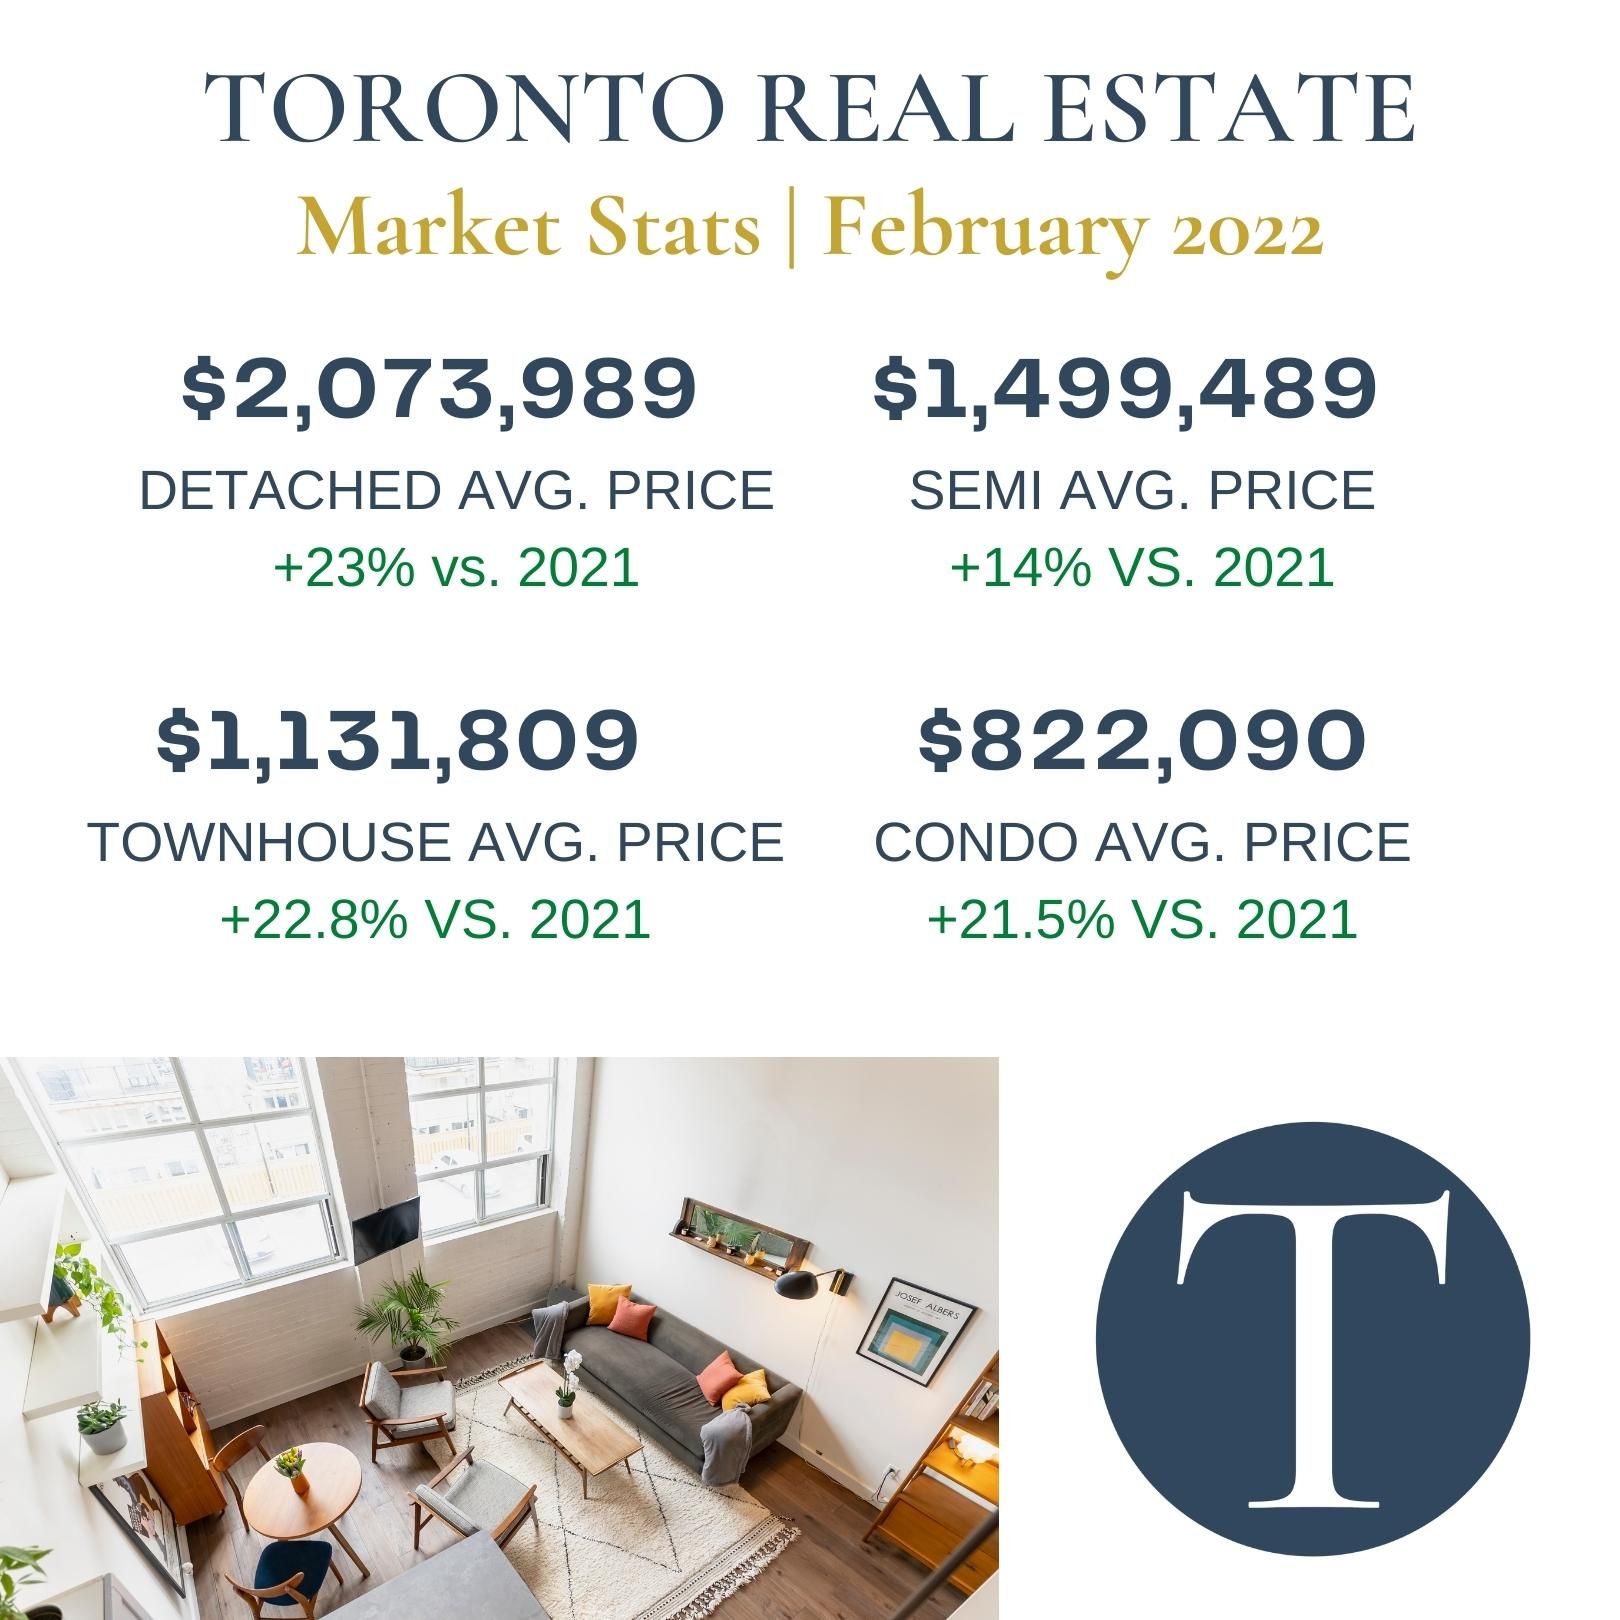
February
- Home sales were down compared to the all-time record in 2021
- Second-best result for the month of February in history
- New listings dropped
- Modest movement towards a slightly more balanced market
- Competition between buyers remained tight
- Supply of low-rise homes (detached, semi, townhouse) was down year-o-ver-year
- Condo listings were up compared to February 2021
- Sales are forecasted to be lower this year due to higher borrowing costs
- Substantial immigration levels will keep demand fairly high
- Continued lack of supply
- Pace of price growth varied by home type & region
- Some households putting home purchase on hold for now
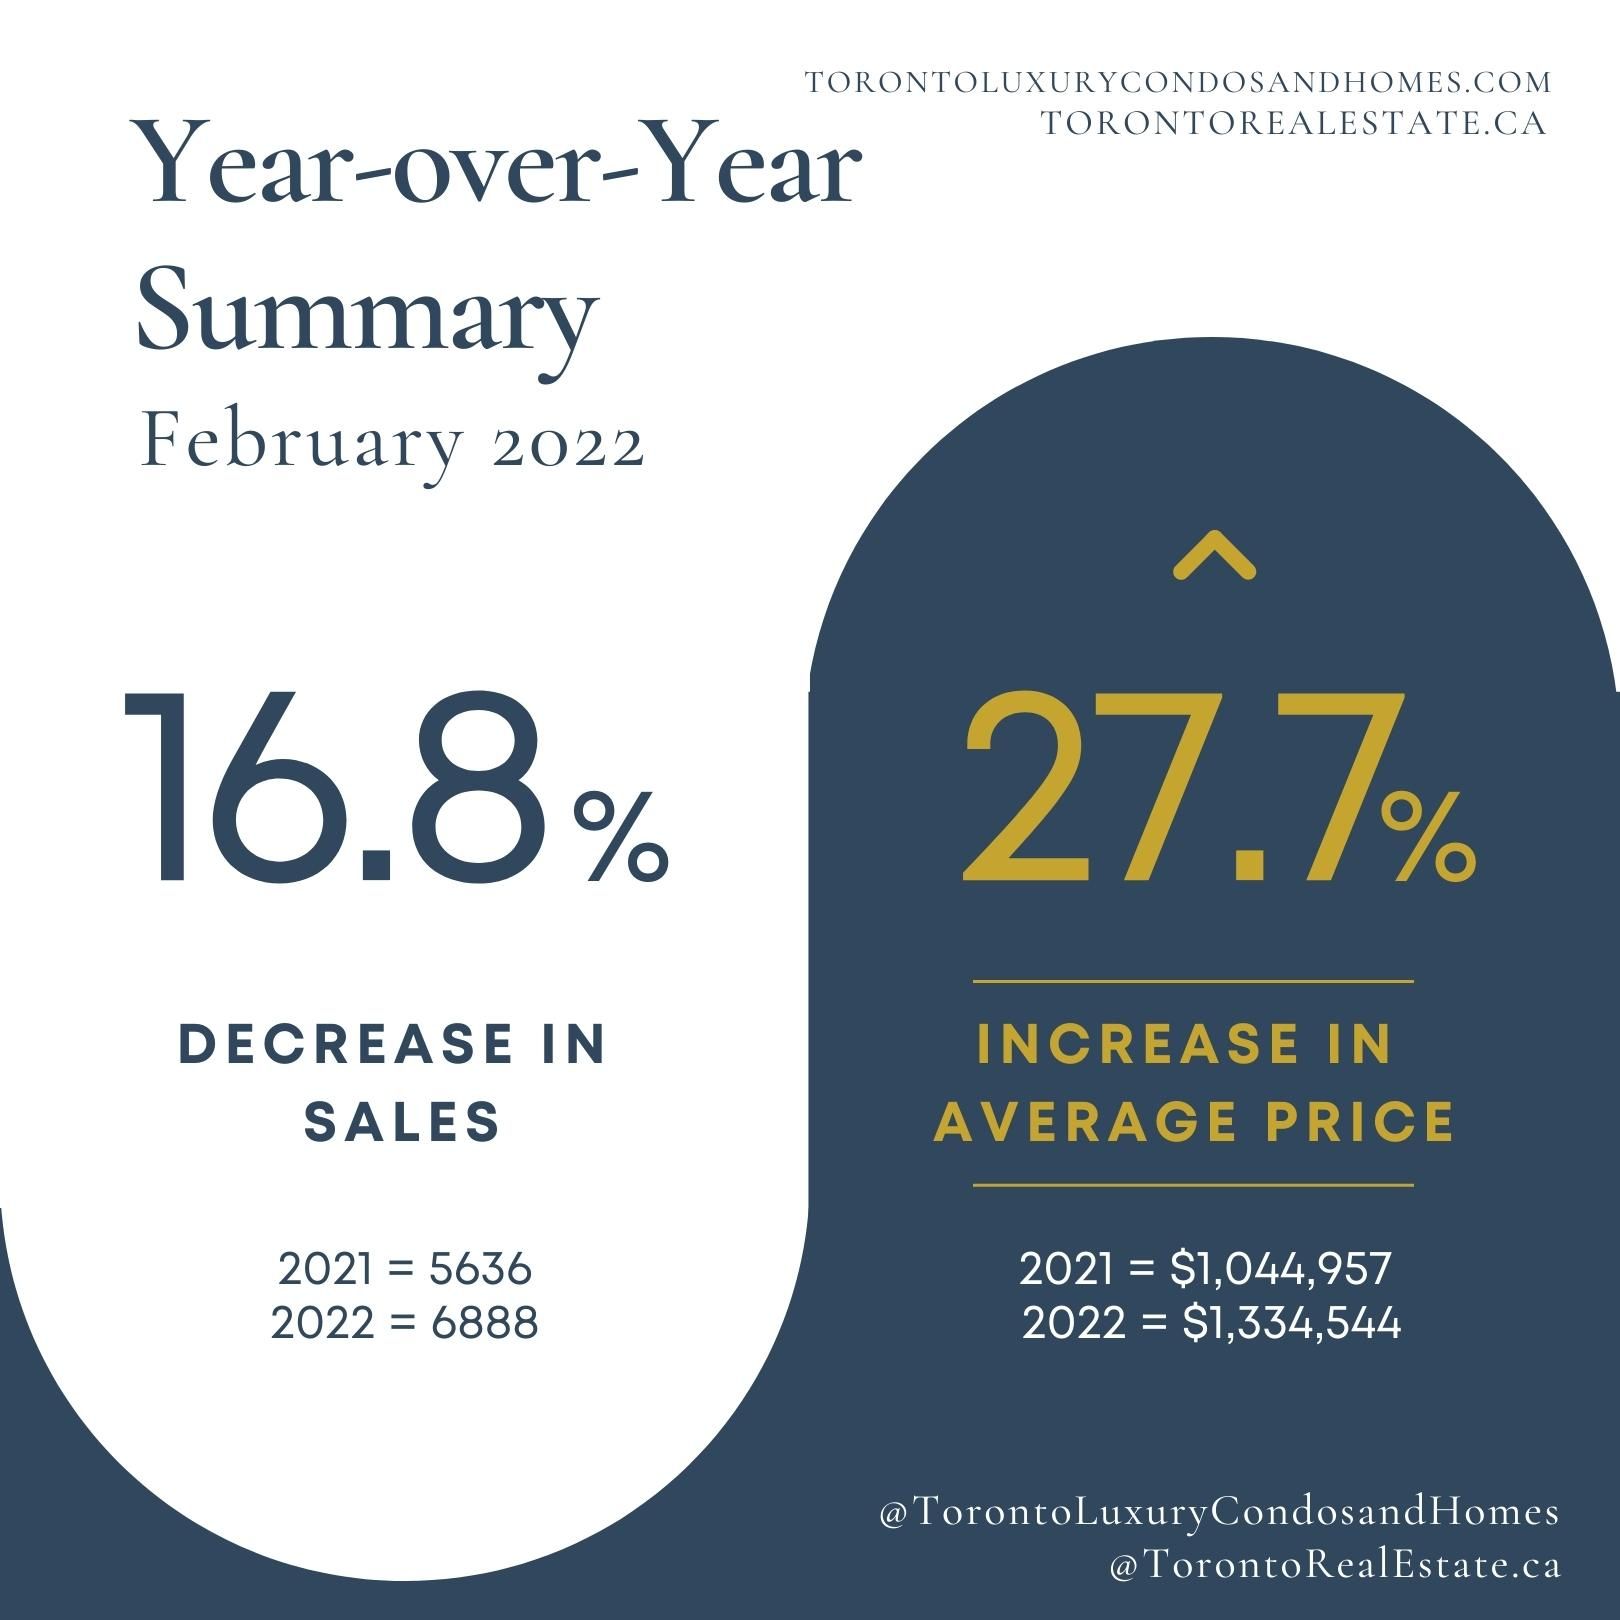
- Sales | 9,097 (-16.8% vs. 2021)
- New Listings | 14,147 (-6.6% vs. 2021)
- Active Listings | 6,985 (-20% vs. 2021)
- Average price | $1,334,544 (+27.7% vs. 2021)
- Detached | Average price = $2,073,989 (+23%) | Sales = 786 (-13.4%)
- Semi-Detached |Average price = $1,499,489 (+14%) | Sales = 263 (-10.5%)
- Townhouse | Average price = $1,131,809 (+22.8%) | Sales = 322 (-5.8%)
- Condo | Average price = $822,090 (+21.5%) | Sales = 1,842 (-14.7%)
March

- 3rd best March in history
- Tight market conditions
- Average sale price dipping slightly month-over-month which is counter to what normally happens at this time of year
- Sales were down 30%
- New listings were down on a year-over-year basis
- Home buyers are not experiencing the same level of competition from other buyers compared to last year
- Mix of homes sold in March shifted in favour of condos vs. freehold properties
- Switch from trend seen over past year ~ returning to market more similar to 2019 as people return to offices and suburban living becomes less attractive (home prices, fuel costs, increasing commuting times, etc.)
- Competition remained fairly strong in most neighbourhoods across the city but certain segments have become more balanced that what have seen in previous years
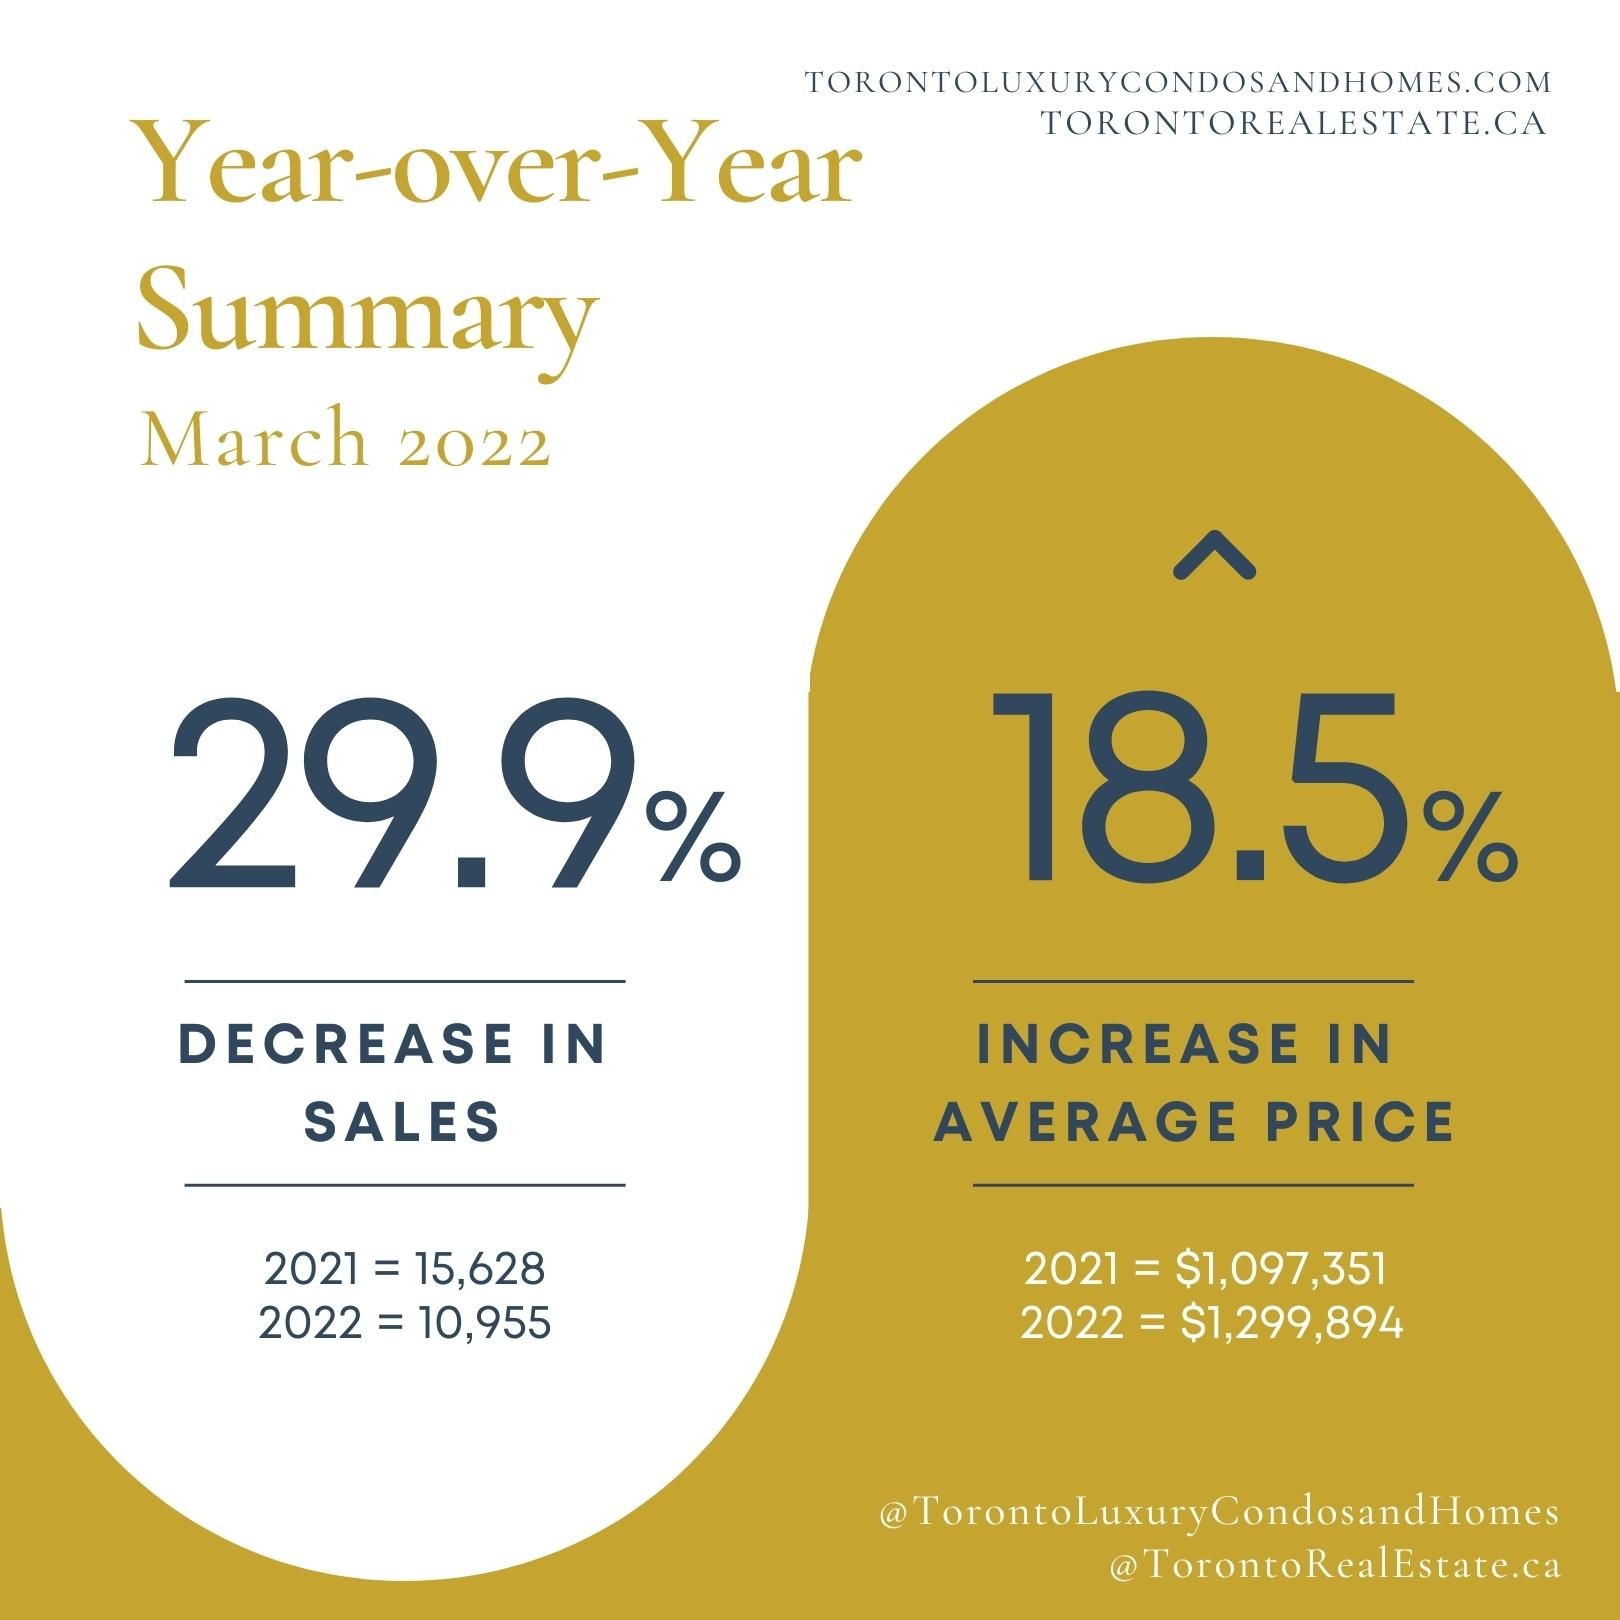
- Sales | 10,955 (-29.9% vs. 2021)
- New Listings | 20,038 (-11.9% vs. 2021)
- Active Listings | 10,167 (-4.1% vs. 2021)
- Average price | $1,299,894 (+18.5% vs. 2021)
- Detached | Average price = $1,920,018 (+9.5%) | Sales = 1,098 (-23.9%)
- Semi-Detached | Average price = $1,545,447 (+20%) | Sales = 331 (-29.7%)
- Townhouse | Average price = $1,117,469 (+16.3%) | Sales = 388 (-30.1%)
- Condo | Average price = $831,351 (+17.4%) | Sales = 2141 (-18.3%)
So what is Q2 going to look like for Toronto and the GTA?
Obviously this is subject to change from events happening around the world which could impact everything but it seems like we could be heading for a more "relaxed" market going forward into April/May/June.
This "cooling" of the market could cause some sellers to pull back from listing their homes which would shrink inventory up again and this could ultimately create conditions more similar to what we were seeing happen in late 2021.
Condos are likely to become the strongest segment in the market as they remain the most affordable housing option along with the fact that many people are returning to Downtown living which will bring about more demand than we have seen over the past 2 years.
The luxury sector over $2 million will remain extremely strong/active as we are seeing a large generational shift from baby-boomers who are "right-sizing" from their homes into large condos in fairly central locations (Yonge & York Mills, St. Clair, Rosedale, etc).
We actually have numerous clients in this exact situation right now so it's definitely a trend to keep an eye on as the year progresses!
What do you think is going to happen in the rest of 2022?
Let me know in the comments section below!
Rylie C.
Sources
https://trreb.ca/files/market-stats/market-watch/mw2201.pdf
Comments