The landscape of the Toronto real estate market has drastically shifted in the second quarter of 2022 as a result of the sweeping economic controls the Bank of Canada has exerted over the past several months.
To summarize what's been going on this quarter as best as possible:
- Interest rates have risen to levels not seen in over 10 years which has reduced the purchasing power of many prospective buyers.
- Many buyers are sitting on the sidelines watching to see if prices go lower but this in turn has scared many people from listing their home so we're in "wait & see" pattern
- Inventory levels generally remain low as a result of this but conversely there are fewer active buyers than before so we are seeing some negotiating power handed over from the sellers to buyers
- Unless highly motivated, many sellers are deciding to terminate their listing instead of accepting a low-ball offer with the plans to re-list when things are more favourable in the future
- Sales numbers have halved on a year-over-year basis
- Average prices are still increasing, however not nearly as high as the feverish pace we experienced through 2022
For a better understanding, let's look at what happened month by month throughout Q2.
April
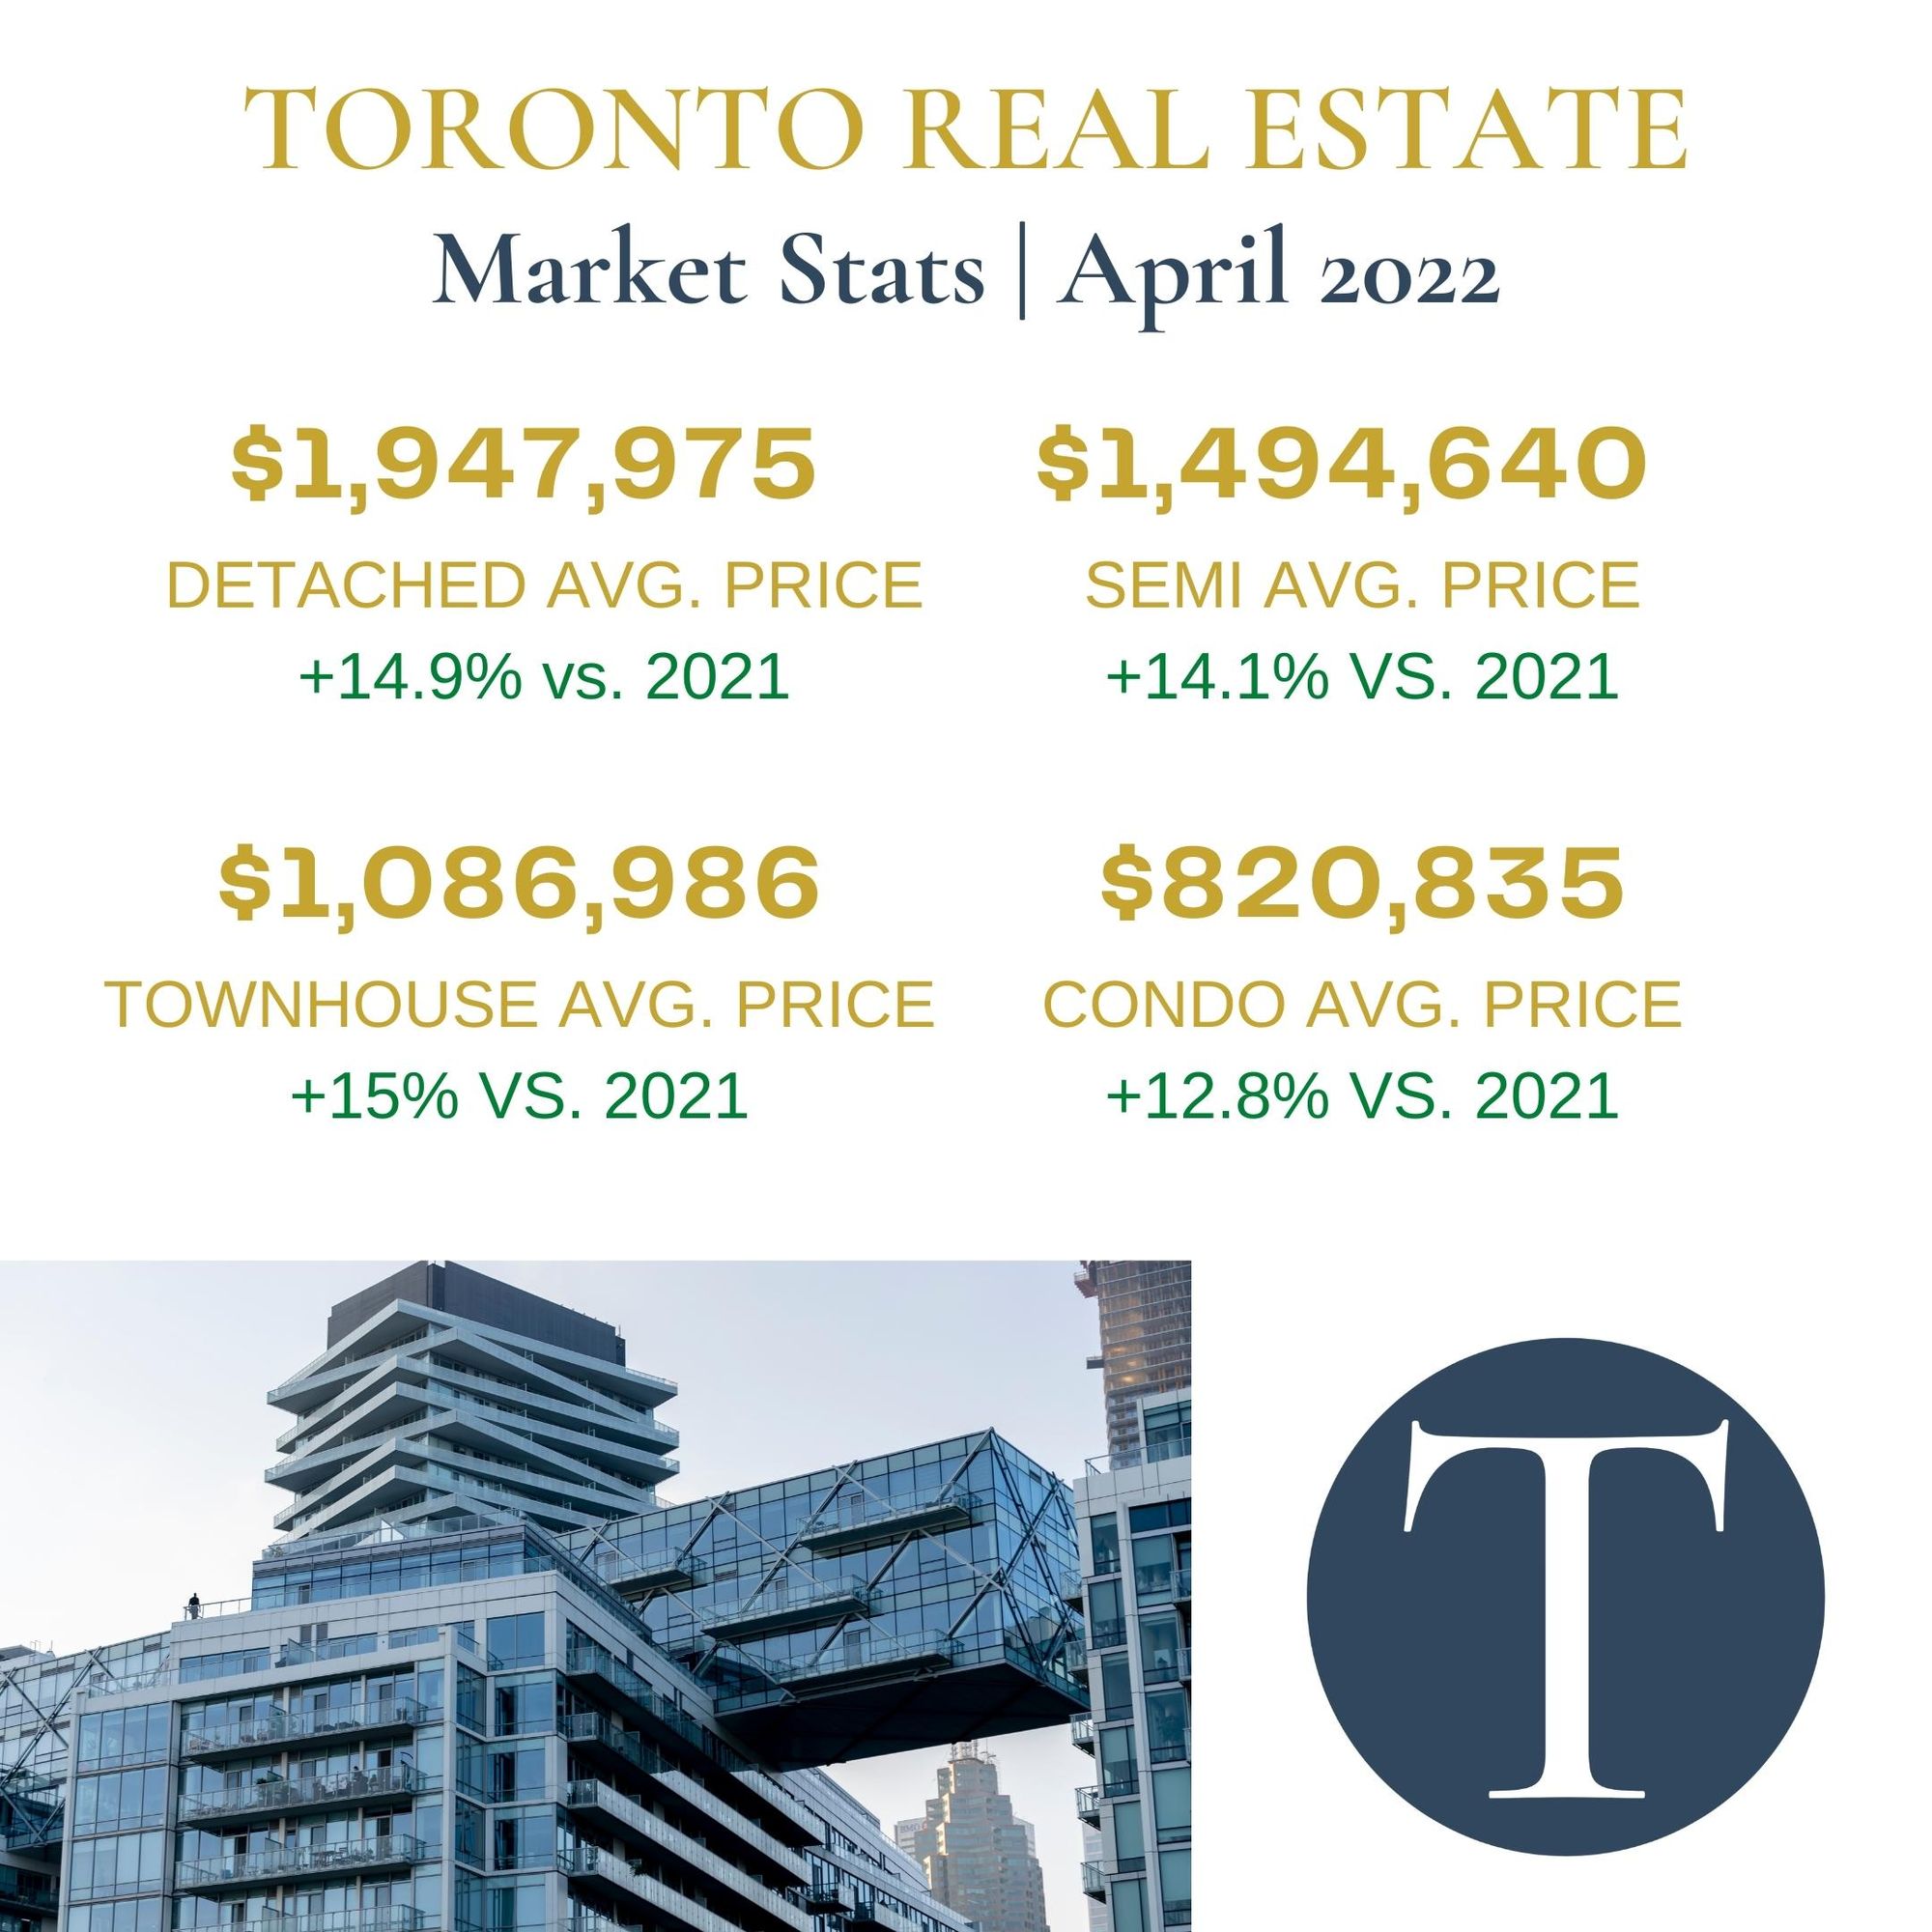
- Market adjusted as higher borrowing costs left many home buyers on the sidelines or with much less purchasing power than before
- As a result of this, the number of transactions was down on both a month & annual basis
- Detached homes in the 905 area's experienced the largest downturn in terms of sales with nearly a 50% reduction
- City of Toronto still saw strong price growth as demand continues to exceed supply
- Condos saw the highest amount of sales activity as it still remains the most affordable way to enter the market
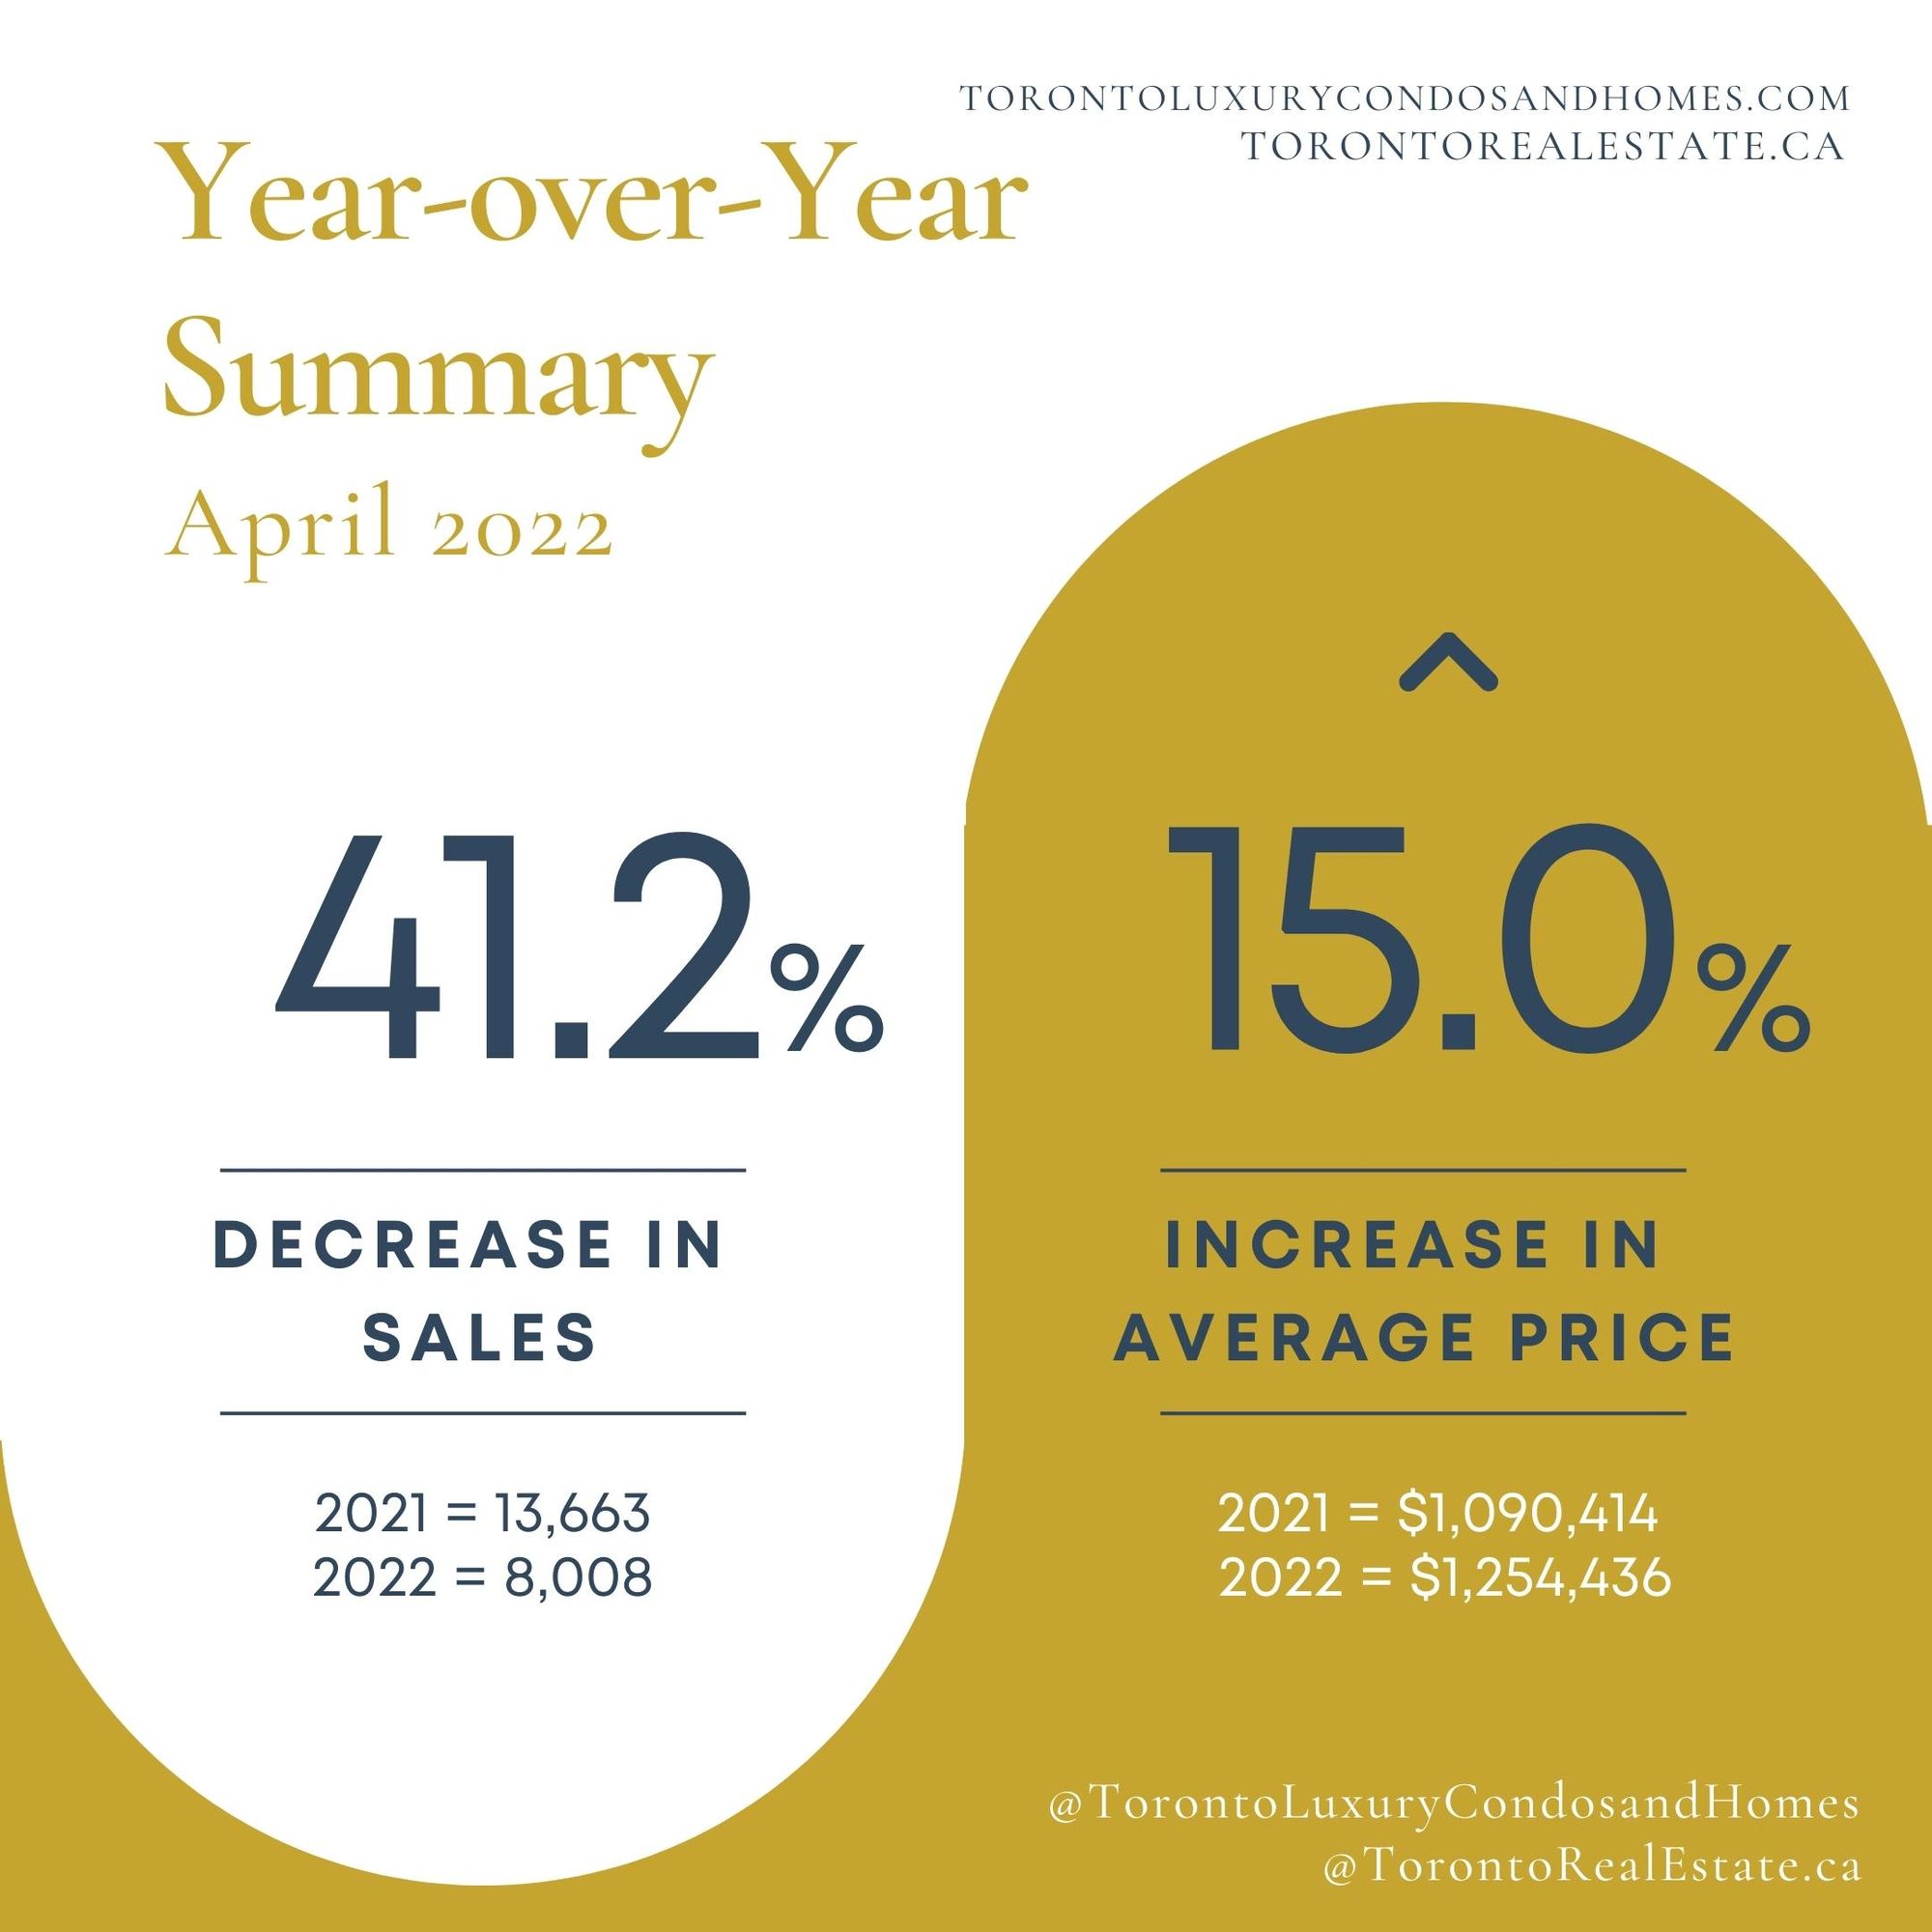
- Sales | 8008 (-41.2% vs. 2021)
- New Listings | 18,413 (-11.7% vs. 2021)
- Active Listings | 13,098 (+12.3% vs. 2021)
- Average price | $1,254,436 (+15% vs. 2021)
- Detached | Average price = $1,947,975 (+14.9%) | Sales = 868 (-34%)
- Semi-Detached | Average price = $1,494,640 (+14.1%) | Sales = 311 (-35.7%)
- Townhouse | Average price = $1,086,986 (+15%) | Sales = 335 (-41.6%)
- Condo | Average price = $820,835 (+12.8%) | Sales = 1488 (-34.5%)
May
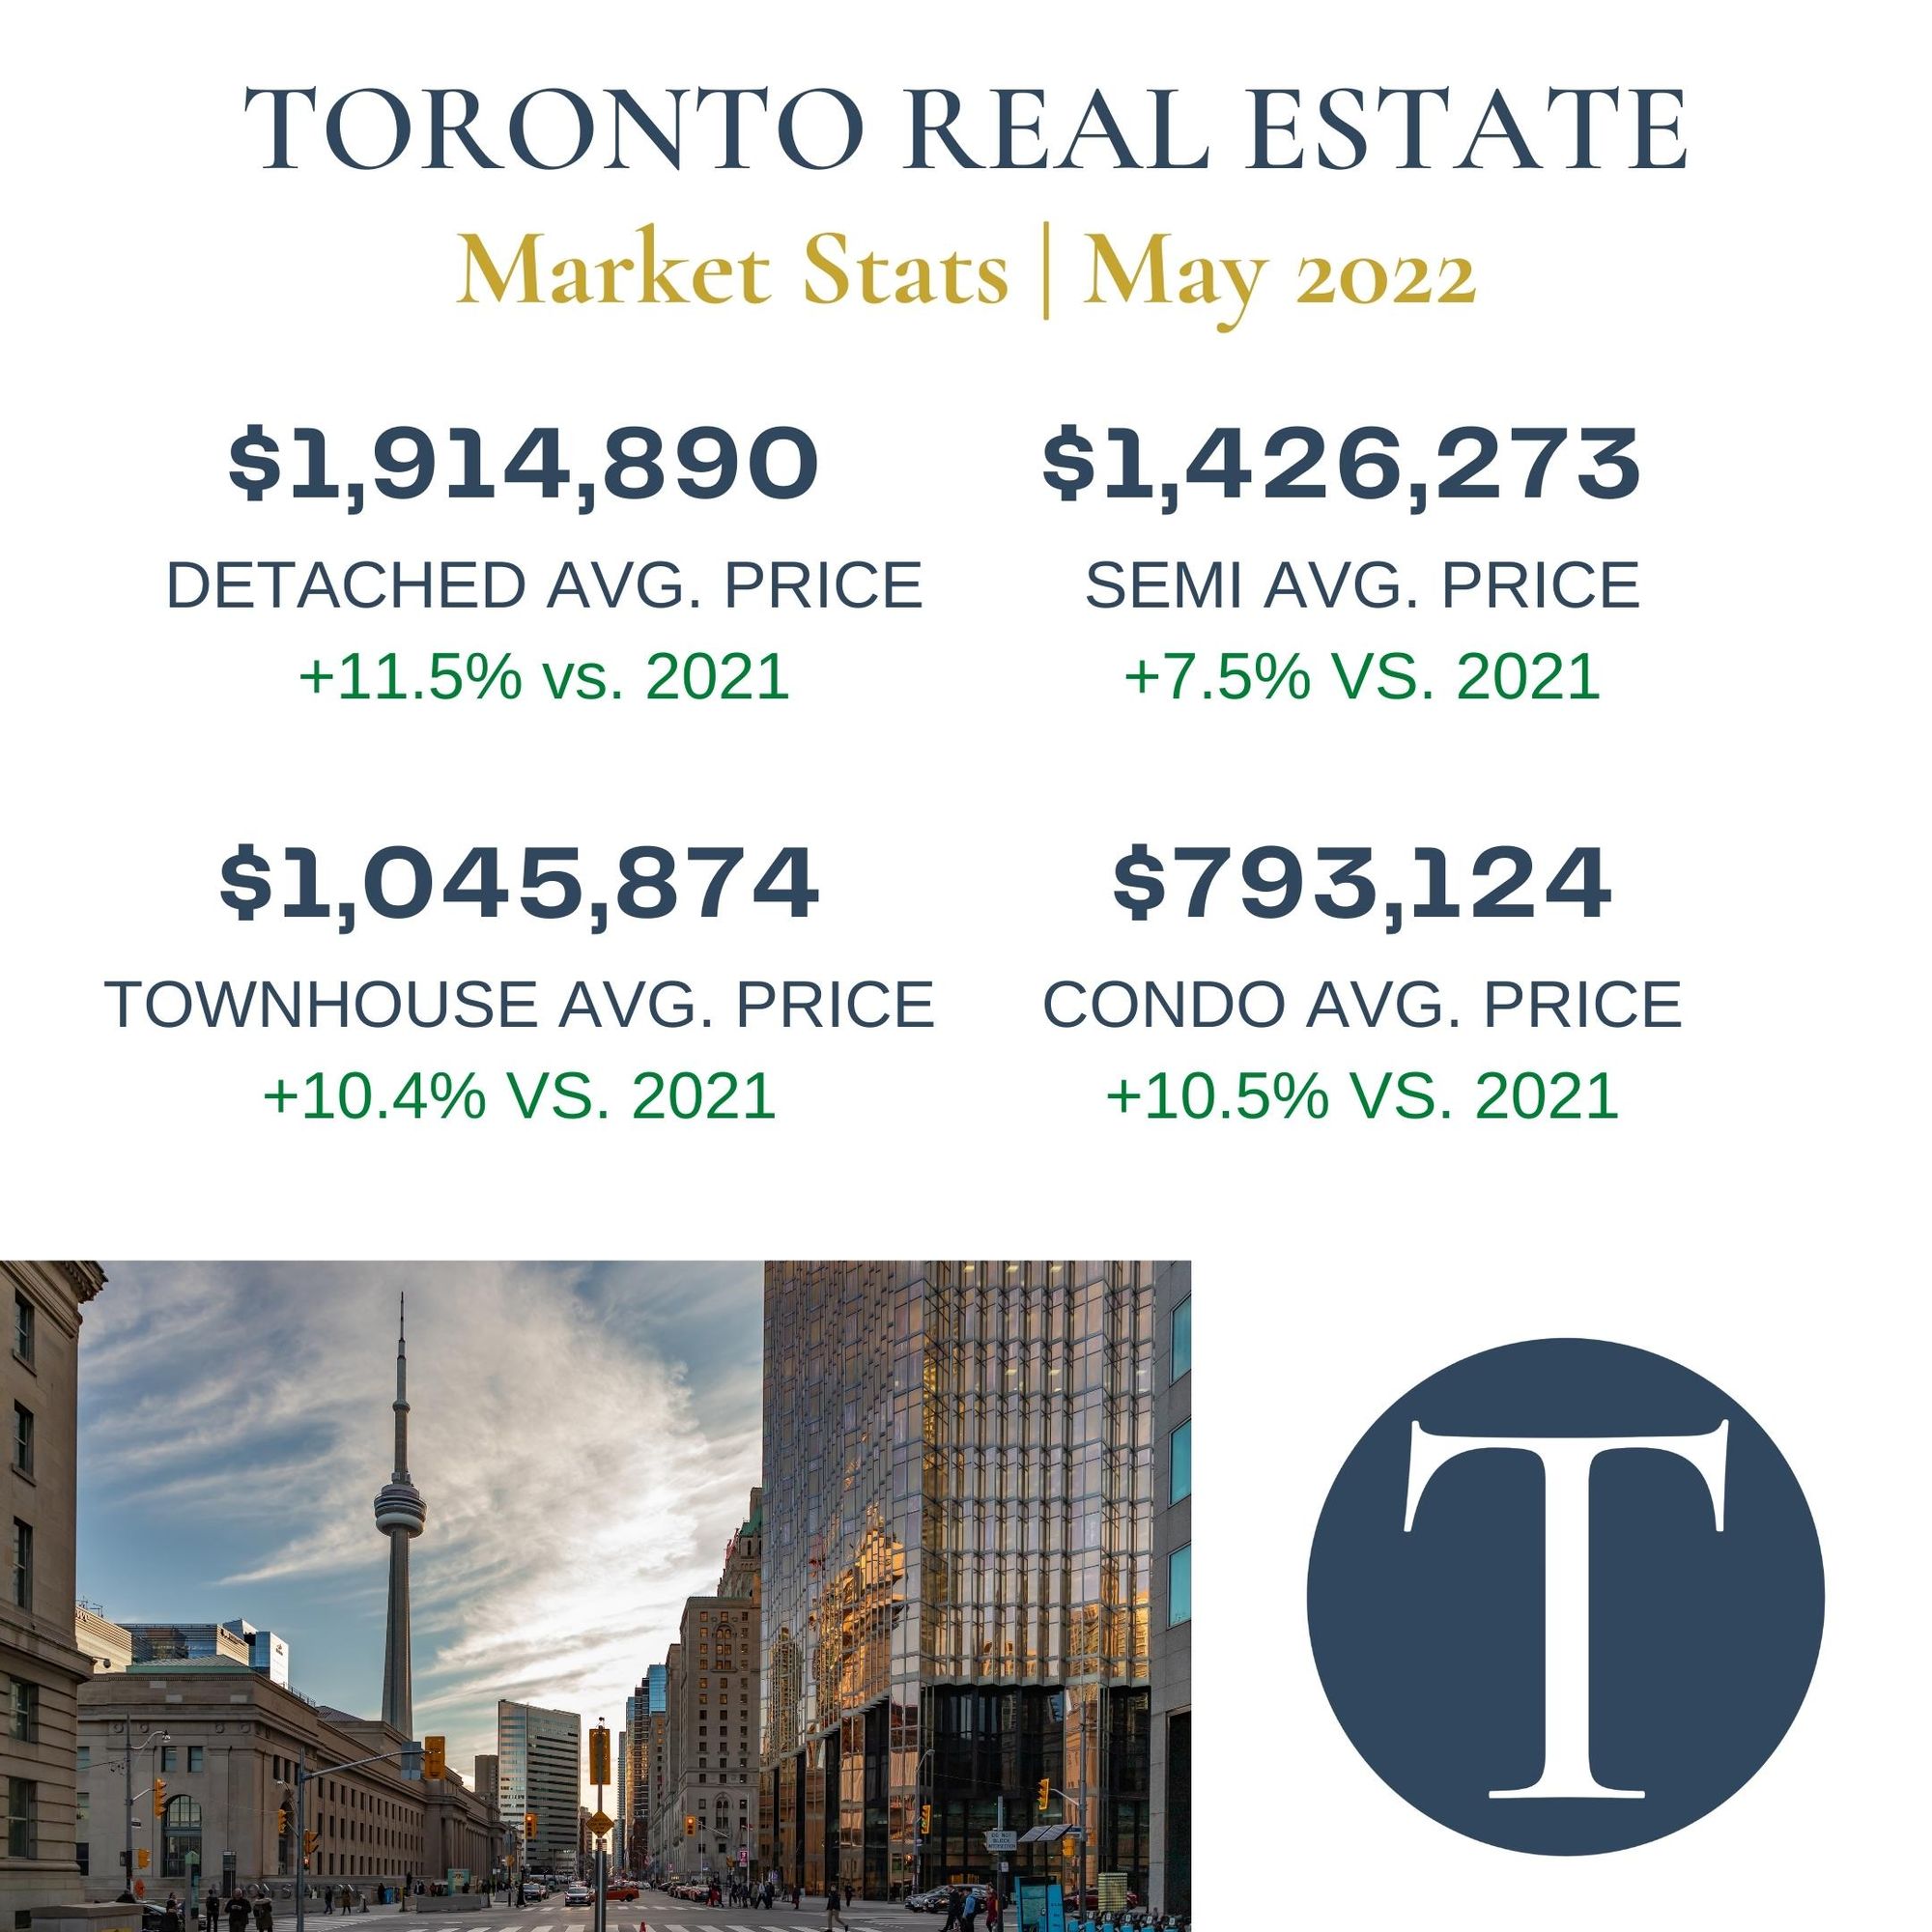
- Sales were down again in response to the increasing borrowing costs that come along with the Bank of Canada rising interest rates
- Monthly sales were down on a month-to-month & yearly basis
- As there are fewer buyers in the marketplace, it has brought about some negotiating power in certain areas
- Townhouse & condo sectors both saw substantial year-over-year price increases but it was detached homes that saw the largest growth
- Still not enough inventory to fill the excess demand in the market & what is available either sells quickly or sits on the market/then terminates when they don't get their desired amount

- Sales | 7283 (-38.8% vs. 2021)
- New Listings | 18,679 (+0.5% vs. 2021)
- Active Listings | 15,433 (+26% vs. 2021)
- Average price | $1,212,806 (+9.4% vs. 2021)
- Detached | Average price = $1,914,890 (+11.5%) | Sales = 814 (-34.8%)
- Semi-Detached | Average price = $1,426,273 (+7.5%) | Sales = 316 (-29.1%)
- Townhouse | Average price = $1,045,874 (+10.4%) | Sales = 267 (-47.9%)
- Condo | Average price = $793,124 (+10.5%) | Sales = 1,264 (-32.5%)
June
- Number of transactions was down again on a month-over-month & yearly basis due to the higher borrowing costs associated with the Bank of Canada interest rate hikes
- While there is usually a bit of a summer slowdown effect, this appears to be even more pronounced than years past
- While the number of active listings is up drastically, sales are down substantially.
- This generally implies that sellers are not willing to accept lower priced offers that buyers want to provide given the current economic climate/shifts in interest rates
- Despite the lower number of sales, average sale prices through Toronto increased
- Townhouse & condo sectors performed the best in Toronto with the highest levels of average price appreciation

- Sales | 6474 (-41.4% vs. 2021)
- New Listings | 16,347 (+1.0% vs. 2021)
- Active Listings | 16,093 (+42.5% vs. 2021)
- Average price | $1,146,254 (+5.3% vs. 2021)
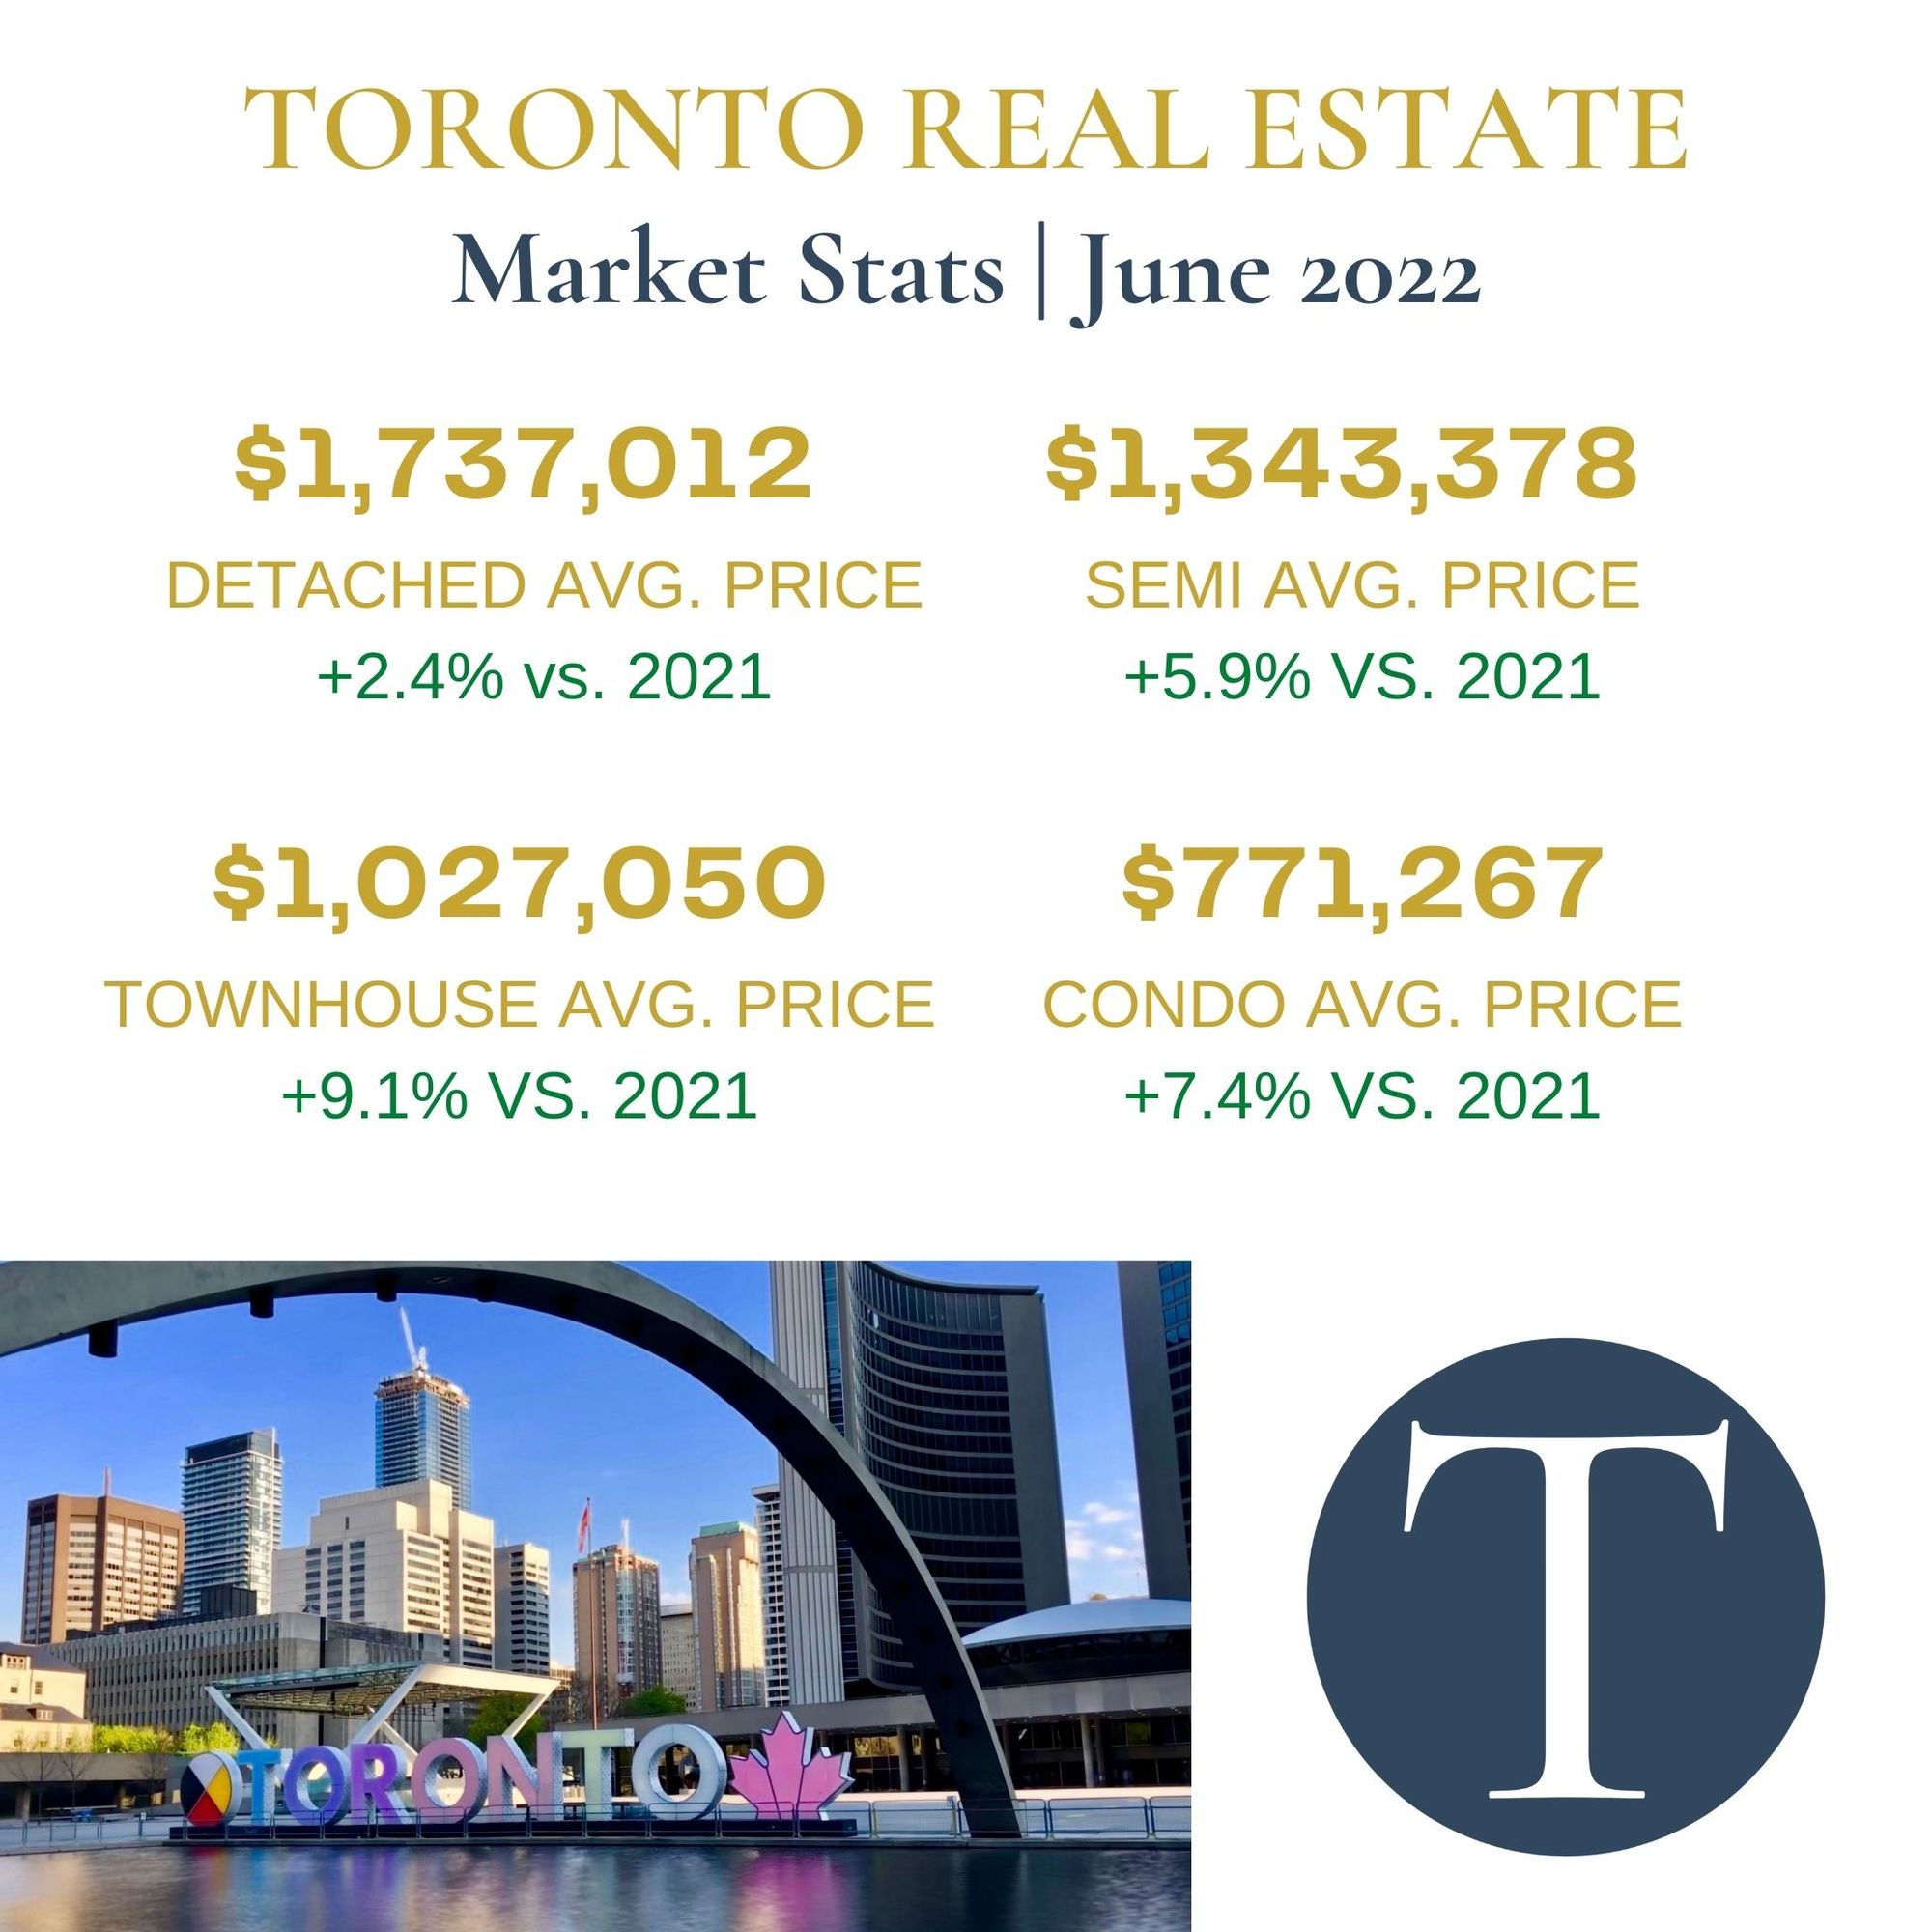
- Detached | Average price = $1,737,012 (+2.4%) | Sales = 747 (-30.8%)
- Semi-Detached | Average price = $1,343,378 (+5.9%) | Sales = 245 (-41.8%)
- Townhouse | Average price = $1,027,050 (+9.1%) | Sales = 243 (-42.6%)
- Condo | Average price = $771,267 (+7.4%) | Sales = 1165 (-38.5%)
As you can see, the trend is quite clear over Q2.
Sales are down drastically when compared to the intensity of the 2021 market.
Average prices are still rising, just at a more moderate level.
Active listings are much higher when compared to last year, however not all of these are selling due to the unfavourable market conditions that have arisen from the Bank of Canada interest rate increases.
Summer time is always our slowest season but it seems like this trend will persist & deepen as we reach July/August with even more buyers going away on vacation or waiting to see what happens with the economy in the coming months.
Have any questions?
Feel free to message me on Instagram @TorontoRealEstate.ca !
Rylie C.
Comments